Pandas Qcut – A new approach to create bins in pandas
What do you do when you have a whole lot of numerical variables all on a varying scale. It essentially becomes difficult to analyze data in these situations. The first thing that we as Data Scientists do is to try and divide the data into bins mostly using histograms. Histograms are intuitive dividing the data equally into the bins. But once we have understood, how do we use these bins. That’s where quartiles or quantiles come into picture. With qunatiles we can essentially divide a numerical feature into a categorical features. Lets see how used to calculate quantiles earlier.
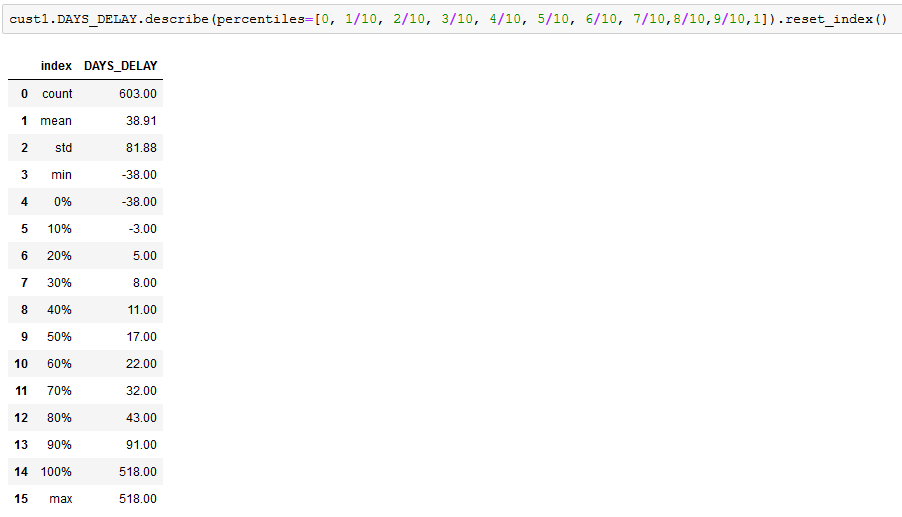
It can be easily done using pandas describe, using percentiles parameter. One can pass an array of quantiles e.g. [0.1, 0.2, 0.3, 0.4, 0.5, 0.6, 0.7, 0.8, 0.9, 1.0] and pandas will show you quantile values at respective intervals passed. Though is very useful to look at but incase I want to use these quantiles as a categorical feature in my workflow its pretty tedious to do it this way. In the example below, minimum value is decile value at 0 percentile, Median is at 50% and so on.
One can also use the numpy quantile function and you will get exactly the same results and with same challenges. Thats where the pandas qcut comes into picture. It makes this task extremely easy. Lets see how.
qcut is a quantile based function to create bins. Pandas qcut cuts down a lot of work when working on deciles and quartiles. Its an intuitive function to add deciles or quartiles to your dataframe and then carry out analysis using the same.
Usage – pandas.qcut(x, q, labels=None, retbins=False, precision=3, duplicates=’raise’)
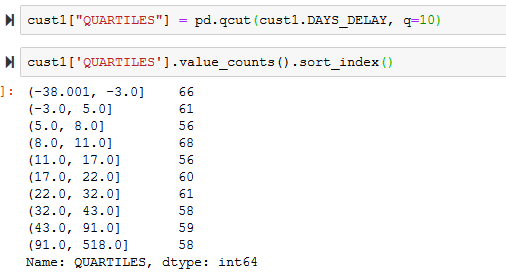
Look at the bins here, These are exactly the same as you saw with the describe example above. The round and square bracket signify open and closed interval. Round bracket at left end means that point is not included and square bracket means point is included. You can read it like, (a,b] = a < x <= b. Simple isn’t it.
With the labels parameter, one can provide labels to each of these category, Lets just see it in action below.
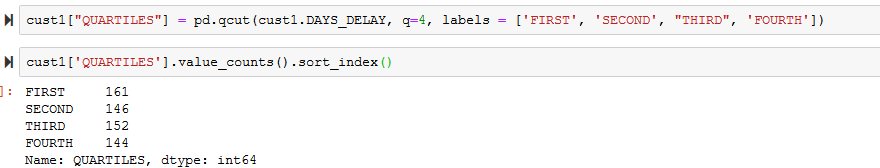
See, how we have just created a new categorical variable which bins our customers on a parameter. One can be more creative and combine labels even further. In the example below, I combined Second and Third category into a new category called Med (Medium) and First and Fourth into Low and High respectively.
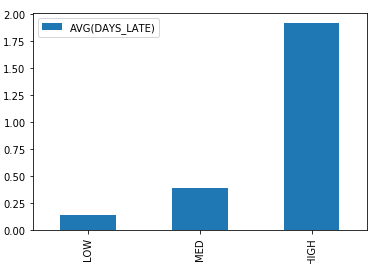
0.25 & 0.5 into the label Med
You can do a lot of different operations once you have the quartiles and deciles and trust me it is very insightful at times.
Conclusion:
Pandas qcut function can be used for data binning and finding the data distribution in custom intervals
It generates equally sized quantile bins for the given data
Comment back or share if you have done something similar using qcut in pandas.